


Data analysis is the process of examining, cleaning, transforming, and interpreting data to find useful information and make better decisions. It helps businesses understand customer behavior, researchers identify patterns, marketers measure campaign performance, and organizations solve practical problems using evidence rather than guesswork.
As companies collect information from websites, applications, transactions, surveys, and connected devices, the ability to turn raw data into meaningful insights has become increasingly important. However, collecting large amounts of information does not automatically lead to better decisions. The real value comes from asking the right questions, selecting appropriate analytical methods, and interpreting the results correctly.
Modern data analysis also uses artificial intelligence, machine learning, and automated tools to identify patterns and process information more efficiently. These technologies can save time, but they do not eliminate the need for human judgment. This guide explains how data analysis works, the different methods involved, the tools professionals use, and how beginners can develop practical skills for real-world applications.
What Is Data Analysis?
Data analysis is a structured process that converts raw information into understandable findings. It involves organizing data, checking its quality, applying suitable techniques, and interpreting the results to answer a specific question.
For example, an online store might notice that its sales have declined over the past three months. Instead of immediately increasing its advertising budget, the business can analyze website traffic, conversion rates, product prices, customer feedback, and previous sales records. This investigation may reveal that fewer visitors are completing purchases because shipping costs have increased.
The purpose of the analysis is not simply to produce charts or reports. It is to understand what the available evidence shows and determine which actions are most likely to address the problem.
Why Is Data Analysis Important?
Data analysis helps people replace assumptions with evidence. It can reveal trends that are difficult to recognize by examining individual records or relying on memory.
Its main benefits include:
- Better decisions: Compare alternatives using measurable evidence.
- Problem identification: Find unusual patterns, inefficiencies, and potential causes.
- Improved planning: Estimate demand and allocate resources more effectively.
- Performance measurement: Track progress against specific business objectives.
- Risk management: Identify warning signs before they become larger problems.
Good analysis does not guarantee that every decision will succeed. It improves the quality of the evidence available when making that decision.
How Does Data Analysis Work?
Data analysis usually follows several connected stages. The exact process depends on the project, but most analytical work begins with a question and ends with findings that someone can use.
1. Define the Problem
The first step is deciding what needs to be understood. A vague question such as “Why is the business performing poorly?” is difficult to investigate because it covers too many possibilities.
A more useful question might be, “Why did the website’s purchase conversion rate decrease during September?” This gives the analyst a measurable outcome and a defined period to examine.
2. Collect Relevant Data
The next step is gathering information that can help answer the question. Sources may include sales databases, customer surveys, website analytics, spreadsheets, application logs, or public datasets.
The quality of the result depends partly on whether the collected information is relevant and representative. Data from only one customer group, for instance, may not explain the behavior of the entire market.
3. Clean and Prepare the Data
Raw datasets often contain missing values, duplicate records, inconsistent date formats, spelling differences, or incorrect entries. These problems can distort the results if they remain unresolved.
Data preparation may involve removing duplicates, standardizing categories, correcting verified errors, and deciding how to handle missing information. Analysts should document important changes rather than silently altering records that could affect the conclusions.
4. Analyze and Interpret the Results
Once the data is ready, the analyst selects an appropriate method. This could involve calculating averages, comparing groups, measuring relationships, building a statistical model, or identifying changes over time.
The results must then be interpreted in context. A strong relationship between two variables does not necessarily mean that one causes the other. Additional evidence or a carefully designed experiment may be needed to establish causation.
5. Communicate Findings and Take Action
The final stage is explaining what the analysis means. Charts, dashboards, written reports, and presentations can help different audiences understand the findings.
A useful report answers three questions: What did the analysis reveal? Why does it matter? What should happen next? After taking action, organizations can monitor the results and repeat the analysis when new information becomes available.
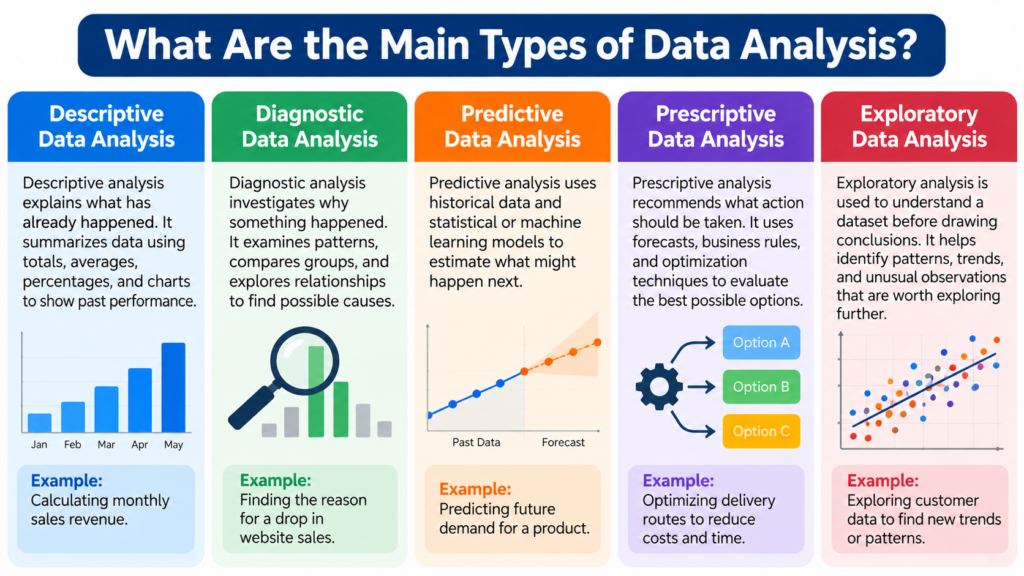
What Are the Main Types of Data Analysis?
Different analytical methods answer different questions. Choosing the right approach is essential because a technique that describes past performance may not be sufficient to explain causes or predict future outcomes.
Descriptive Data Analysis
Descriptive analysis explains what has already happened. It summarizes information through totals, averages, percentages, distributions, and charts.
A retailer might use it to calculate monthly revenue, identify its best-selling products, or compare sales across locations. It provides a clear picture of performance but does not necessarily explain why the results occurred.
Diagnostic Data Analysis
Diagnostic analysis investigates why something happened. Analysts compare groups, examine relationships, investigate unusual changes, and test possible explanations.
For example, if website sales fall, an analyst might compare traffic sources, devices, product categories, and checkout completion rates. The investigation can narrow down possible explanations, although observational data alone may not establish the true cause.
Predictive Data Analysis
Predictive analysis uses historical information and statistical or machine learning models to estimate what might happen next.
Businesses may use it to forecast demand, estimate customer churn, identify transactions that appear fraudulent, or predict equipment maintenance needs. Predictions are estimates, not guarantees, and their reliability depends on data quality, model design, and how conditions change over time.
Prescriptive Data Analysis
Prescriptive analysis helps evaluate what action should be taken. It may combine forecasts, business rules, optimization techniques, and constraints to compare possible decisions.
For instance, a delivery company could use route optimization to identify efficient delivery schedules while considering vehicle capacity, delivery deadlines, and travel distances. The recommended solution still needs to be checked against practical requirements.
Exploratory Data Analysis
Exploratory data analysis, commonly called EDA, is used to understand a dataset before committing to a particular explanation or model.
Analysts inspect distributions, compare variables, visualize patterns, and investigate unusual observations. EDA can reveal unexpected questions worth exploring, but patterns discovered during exploration should be tested carefully before being treated as reliable findings.
Common Data Analysis Methods and Techniques
The methods used in a project depend on the type of data, the question being investigated, and the level of certainty required.
Statistical Analysis
Statistical analysis uses mathematical methods to summarize data, estimate uncertainty, compare groups, and evaluate hypotheses.
Common techniques include:
- Mean, median, and standard deviation.
- Correlation and regression analysis.
- Confidence intervals and hypothesis testing.
- Probability distributions and sampling methods.
For example, a company comparing two customer groups might use statistical tests to determine whether an observed difference is consistent with random variation. The method must match the data and study design.
Qualitative and Quantitative Analysis
Quantitative analysis focuses on numerical information, such as prices, sales totals, survey ratings, and website visits. It is useful when measuring quantities, comparing results, or identifying numerical patterns.
Qualitative analysis examines non-numerical information, including interview transcripts, customer comments, open-ended survey responses, and documents. Researchers may group responses into themes to understand customer concerns or motivations.
Many projects benefit from combining both approaches. Numerical data can show how frequently a problem occurs, while qualitative evidence can help explain how people experience it.
Time Series and Comparative Analysis
Time series analysis examines measurements collected over time. It can help identify trends, recurring seasonal patterns, and changes in behavior.
Comparative analysis examines differences between groups, periods, products, or locations. A business might compare this quarter’s revenue with the previous quarter, while accounting for seasonal demand and changes in pricing.
These methods are useful, but comparisons can become misleading when important conditions differ between the groups being examined.
Data Analysis Tools and Software
The right tool depends on the size of the dataset, the complexity of the analysis, the user’s experience, and the organization’s technical requirements.
| Tool | Main Purpose | Best Suited For |
|---|---|---|
| Microsoft Excel | Spreadsheets, formulas, charts, and pivot tables | Beginners and small to medium datasets |
| Google Sheets | Collaborative spreadsheets and basic analysis | Teams and simple reporting |
| SQL | Retrieving and manipulating database records | Working with structured data |
| Python | Data cleaning, automation, statistics, and machine learning | Flexible and repeatable analytical workflows |
| R | Statistical computing and visualization | Research and statistical analysis |
| Power BI | Interactive reports and dashboards | Business intelligence and performance monitoring |
| Tableau | Data visualization and interactive dashboards | Exploring and communicating patterns |
Choosing the Right Tool
Excel and Google Sheets are practical starting points because they make basic calculations and visualizations accessible. SQL becomes important when information is stored in relational databases and needs to be retrieved efficiently.
Python offers greater flexibility for repeatable workflows, especially when analysts work with large datasets or automate recurring tasks. Libraries such as pandas support data manipulation, while Matplotlib and Seaborn support visualization. R is particularly useful for statistical work and research.
Power BI and Tableau help turn analytical results into interactive dashboards. However, a dashboard is only as reliable as the data and calculations behind it. Buying advanced software cannot compensate for poorly defined questions or inaccurate source information.

How Artificial Intelligence Is Changing Data Analysis
Artificial intelligence is changing how analysts explore datasets, write code, generate summaries, and automate repetitive tasks. Machine learning can identify patterns in large datasets, while generative AI can help people interact with data using natural language.
For example, an analyst might ask an AI assistant to draft a SQL query that calculates monthly sales by product category. The analyst can then inspect the query, run it against the correct database, verify the totals, and use the results in a report.
Common Applications of AI in Data Analysis
AI can support several parts of the analytical workflow:
- Data preparation: Suggest ways to standardize categories or identify inconsistent records.
- Code assistance: Draft SQL queries, Python scripts, and spreadsheet formulas.
- Pattern detection: Help identify unusual observations or relationships that deserve investigation.
- Forecasting: Use machine learning models to estimate future demand or other measurable outcomes.
- Natural-language reporting: Turn verified results into plain-language explanations and summaries.
Traditional statistical methods remain important. AI is not automatically more accurate than a well-designed statistical analysis, and complex machine learning models are not necessary for every problem.
Limitations of AI-Powered Analysis
Generative AI systems can produce incorrect explanations, invent patterns, misunderstand column definitions, or write code that appears correct but calculates the wrong result. They may also overlook missing data or assumptions that would be obvious to an experienced analyst.
Privacy is another concern. Uploading customer records, financial information, or confidential business data to an AI service may create security or compliance risks, depending on the service and its settings.
For reliable results, analysts should validate calculations, check source data, review generated code, and follow organizational data-handling policies. AI works best as an assistant to a controlled analytical process rather than as an unquestioned source of truth.
Real-World Applications of Data Analysis
Data analysis is useful wherever people need to understand patterns, measure outcomes, or make decisions based on evidence.
Business and Marketing
Companies analyze revenue, customer retention, conversion rates, and product performance to understand what drives results.
A marketing team might compare two advertising campaigns by examining cost per acquisition, conversion rates, and the value of customers acquired. Looking only at clicks could lead to the wrong decision if one campaign attracts many visitors but generates few purchases.
Healthcare and Scientific Research
Researchers use data analysis to study experimental results, investigate trends, and evaluate relationships between variables. Healthcare organizations may examine appointment patterns, operational performance, and patient outcomes.
Sensitive information requires strong privacy safeguards, and findings must be interpreted within the limits of the study design. Observational patterns alone should not be treated as proof that a treatment or intervention caused an outcome.
Education and Technology
Educational institutions can analyze attendance, assessment results, and course completion to identify areas where students may need additional support. These findings should be used carefully because numerical performance measures may not capture a student’s full circumstances.
Technology companies analyze application logs, response times, errors, and user interactions to improve software reliability. Data can reveal where users encounter difficulties, helping development teams prioritize practical improvements.
Finance and Operations
Financial organizations use analytical methods to monitor transactions, estimate risk, and identify unusual activity. Manufacturers may examine production records and equipment sensor data to detect quality problems or schedule maintenance.
In each case, the usefulness of the analysis depends on suitable data, appropriate methods, and a clear understanding of the costs of making an incorrect decision.
Benefits and Limitations of Data Analysis
Data analysis offers substantial advantages, but its results should always be evaluated in context.
Key Benefits
- Supports decisions with measurable evidence.
- Helps identify trends and operational inefficiencies.
- Makes performance easier to monitor over time.
- Improves forecasting and resource planning.
- Supports testing, experimentation, and continuous improvement.
Common Challenges
- Poor data quality: Incorrect or incomplete records can distort findings.
- Bias: Unrepresentative data can lead to misleading conclusions.
- Privacy concerns: Sensitive information requires appropriate protection.
- Misinterpretation: Correlation does not automatically establish causation.
- Changing conditions: Historical patterns may not continue into the future.
- Tool complexity: Advanced software may require programming, statistics, or database skills.
A responsible analyst communicates uncertainty and limitations instead of presenting every result as definitive. This is particularly important when decisions affect people’s finances, employment, health, or access to services.
How to Learn Data Analysis as a Beginner
You do not need to master every programming language or statistical technique before starting. A structured learning path can help you develop useful skills gradually.
Step 1: Learn Spreadsheet Fundamentals
Start with formulas, sorting, filtering, conditional formatting, charts, and pivot tables. Practice calculating totals, averages, percentages, and changes over time.
Use a small dataset, such as monthly sales records, to answer specific questions. This helps you understand the purpose of analysis before adding more complex tools.
Step 2: Develop Basic Statistical Knowledge
Learn the difference between mean and median, understand percentages and distributions, and study correlation, sampling, and variation.
These concepts help you avoid common mistakes, such as interpreting an average without checking whether a few unusually large values are influencing it.
Step 3: Learn SQL and a Programming Language
SQL is valuable for retrieving information from databases. Once you understand basic queries, learn how to filter records, group results, join tables, and calculate summary measures.
Python is a useful next step for automating tasks and analyzing more complex datasets. Focus on reading data, cleaning it, performing calculations, and creating clear visualizations before moving to machine learning.
Step 4: Build Practical Projects
Projects demonstrate whether you can apply your knowledge to real questions. Good beginner projects include:
- Analyzing monthly sales and identifying seasonal changes.
- Exploring public transport or weather datasets.
- Comparing website traffic and conversion performance.
- Summarizing customer survey responses.
- Building a dashboard that tracks a small set of business metrics.
For each project, explain the question, data source, preparation steps, method, findings, and limitations. A clear explanation of your reasoning is often more valuable than an elaborate chart.
Frequently Asked Questions About Data Analysis
What is data analysis in simple words?
Data analysis means examining information to discover patterns, answer questions, and make better decisions. It turns raw data into useful findings.
What are the five steps of data analysis?
A practical five-step process is defining the question, collecting data, cleaning and preparing it, analyzing the results, and communicating findings.
Is data analysis difficult to learn?
Beginners can start with spreadsheets and basic statistics. SQL, Python, and more advanced analytical methods can be learned gradually through practice.
Which tool is best for data analysis?
Excel is a good starting point for spreadsheets, SQL for databases, Python for flexible analysis and automation, and Power BI or Tableau for dashboards. The best choice depends on the task.
Can AI perform data analysis?
AI can assist with data preparation, code generation, pattern exploration, and reporting. Its results still require validation because generated code and explanations can be incorrect.
What is the difference between data analysis and data analytics?
The terms overlap. Data analysis usually emphasizes examining data to answer particular questions, while data analytics can refer to the broader practice of using data, methods, and tools to support decisions.
Is coding necessary for data analysis?
No. Many basic tasks can be completed using spreadsheets and visual analytics tools. SQL and programming become more useful when working with larger datasets or automating repeated tasks.
Conclusion
Data analysis is a practical skill that helps people understand information, evaluate possible explanations, and make better-informed decisions. Its value comes from more than collecting numbers or producing attractive dashboards. Analysts must define meaningful questions, prepare reliable data, choose appropriate methods, and communicate findings honestly.
Beginners can develop a strong foundation with spreadsheets and basic statistics before progressing to SQL, Python, visualization, and machine learning. AI tools can make parts of the process faster, but they do not remove the need to verify calculations, protect sensitive information, or recognize uncertainty.
Whether you work in business, education, research, marketing, or technology, learning to analyze data can help you solve problems more systematically. Start with a question that matters, work with relevant information, and let the evidence guide your next step.